
The Ultimate YouTube Advertising Guide
BY THE NUMBERS YouTube is one of the largest search engines, second only to its…

BY THE NUMBERS YouTube is one of the largest search engines, second only to its…
Purchasing advertising on third-party sites can be a challenge since there’s no guarantee your spend…

WE LIVE IN THE FUTURE. We have Dick Tracy-style watches, Star Trek-like voice-to-computer communication, hoverboards…

Wonder what business results and insights you could uncover with a stronger POV on data-driven marketing? Let’s chat and explore how data can boost your marketing performance.
Congratulations, your creative is approved, media buy is scheduled, and marketing analytics and tracking is in place. Your new campaign is officially live. So you can expect campaign insights and analysis in week one, right?
While there’s a strong temptation to review data quickly, there’s several reasons why jumping to analysis can negatively impact the long-term effectiveness of your marketing. Data-driven digital marketing follows a process to identify, gather and analyze data over time. This process begins with planning, continues through each stage of campaign execution, and ultimately becomes a feedback loop to iterate on live campaigns and inform future campaigns.
When thinking about analytics and data-driven marketing, it’s important to remember analytics is not a one-time input or output. During planning, data-driven marketing works in tandem with other business inputs to inform campaign goals, strategies and tactics.
As the expression goes, “Those who cannot remember the past are condemned to repeat it.” Here’s where analytics excels in the planning process—reviewing past performance to improve future marketing ROI.
Effective marketers evaluate past campaigns and ask questions like:
By analyzing past performance and tracking trends in data, businesses can set realistic benchmarks for marketing KPIs and metrics for future campaigns based on real-world results. Plus, understanding how potential customers reacted to different strategies in the past can inform future tactics.
Data in Action: With demand for online education growing, our client the University of Cincinnati Online often engages us to market new programs. Over the past year and a half, we’ve launched campaigns for 14 different programs with the goal of driving relevant leads. But individual program performance hasn’t been the only priority. Understanding the bigger picture that UC Online will continue to add new programs,, we set in place an analytics plan that would gather and leverage months of performance data from all new program campaigns. This process would help us to 1) set benchmarks for new program KPIs and 2) understand how their lead generation progresses over time.
Once a campaign is live, data flows in like a firehose. With a high volume of information, marketers need to understand what’s valid, what’s actionable and what’s representative.
That’s why we identified 5 key metrics to guide brands in evaluating data:
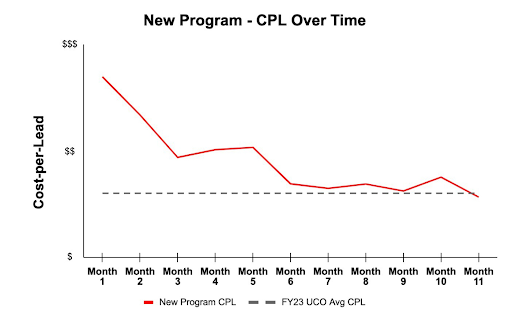
Data in Action: Working with University of Cincinnati Online we gathered data from the first 11 months for all new programs to answer the question: on average, how long does a new program take to ramp up and reach an optimal Cost per Lead? By plotting the combined program data over time, we were able to visualize insights in a more compelling way than a spreadsheet and see where we should dig in to the data further. In this case, we wanted to explore more what was driving the sharper peaks and valleys.
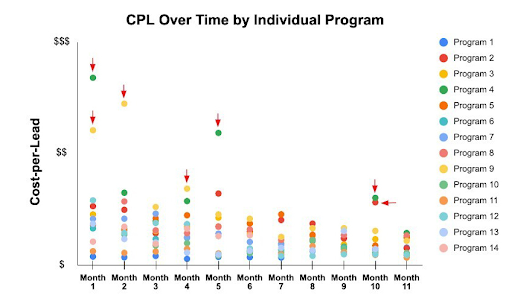
When we visualized the data by department over time, we now could easily see where specific points were not in line with the overarching trends. Identifying and evaluating these outliers sparked discussions about why they may have occurred, as well as solutions for future campaigns.
Data-driven digital marketing requires critical thinking at each stage. This mindset is especially crucial when it comes to making decisions based on campaign performance.
In working on hundreds of digital campaigns, we’ve identified a few common mistakes to avoid when using data for decision-making:
From planning to execution to decision-making, data offers multiple benefits to make your marketing work harder and smarter when you use it over time. When there is a process that guides how data is identified, gathered and analyzed, you can achieve business objectives and spot new opportunities.
Like every great story, a data-driven story follows a simple framework:
For the University of Cincinnati Online, its data-driven story was understanding how digital marketing connected with its customer journey. Analyzing data across new program campaigns helped us identify 3 phases in digital media: learning phase (months 1-4), optimization (month 5-8) and peak efficiency (months 9-onward). Now when planning campaigns, we can focus our spend and our tactics to each unique phase of the digital campaign—and ensure consistency with other marketing channels that potential customers experience in that same time period.
Wonder what business results and insights you could uncover with a stronger POV on data-driven marketing? Let’s chat and explore how data can boost your marketing performance.